
We have all heard the rule about “Only set mine if effective stacks are X times the size of your call.” I suspect we have all heard different versions of this where X varies from 10 up to 30. So which is it and where does this rule come from?
Pocket pairs are both very easy to play and very difficult to play. They are almost never in your continuation range unless they hit a set, full house or quads and that is going to happen about 12% or 13% of the time. That means that 88% of the time you are likely to be done with the hand. That means there will be 7.33 bad flops for every good flop. You have to pay for all of those bad flops, so you need to make at minimum 7.33 times your money just to break even with this “Set or Jet” philosophy.
When you hit your set, do you always win? No? Me neither, so now we need to make even more from our sets when we hit them. When you hit your set, do you always get paid? No? Me neither, so not we need to win even more those times that we get paid.
I am working on a new software tool that helps to quantify these kinds of questions.
Lets take a look at a screen shot from this upcoming software.
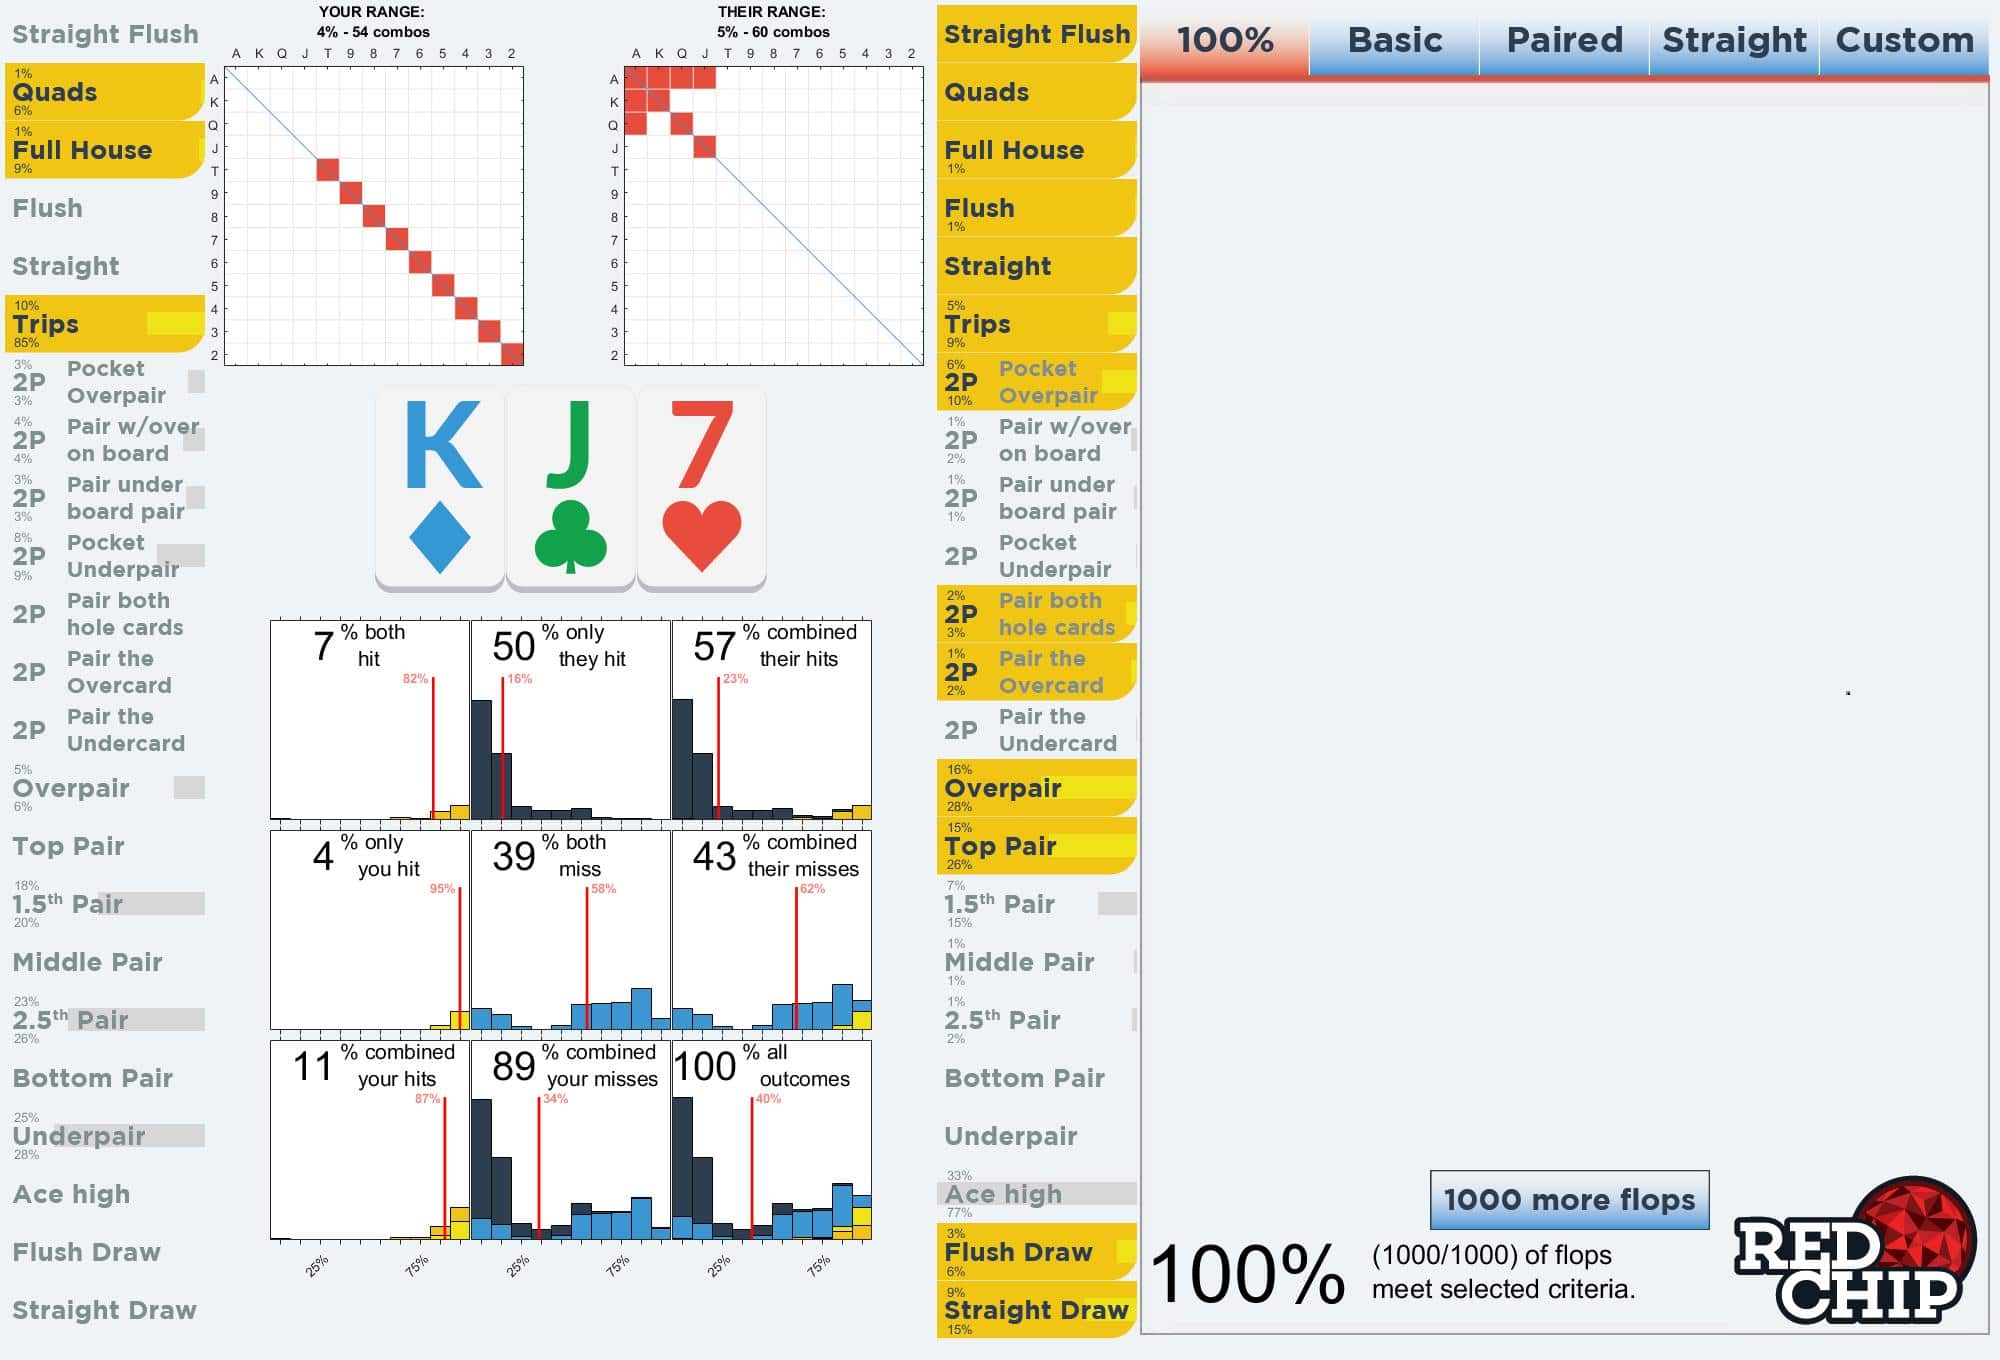
On the left we see our range. It is 22-TT and because we think our Villain is very nitty, we don’t think that we win with a hand as strong as an overpair Tens. We need a set or better, so we have selected the Quads, Full House, and Trips as our criteria for “hitting the flop”. The nitty Villain is going to be much more willing to continue with a top pair and better along with draws.
If we both have this criteria for hitting the flop, we can have four situations:
- Both hit
- Both miss
- Only we hit
- Only they hit
Look at the nine bar charts in the middle. The four histograms (bar charts) in the upper left corner of the nine represent those four buckets. We can see from the labels that we fall in these four scenarios with the following frequency:
- Both hit 7%
- Both miss 39%
- Only we hit 4%
- Only they hit 50%
Since we are going with the “Set or Jet” theory, we add our hits up and that is the lower left corner with 11%. We can also add up the other rows and columns to look at all our misses (89%) all of their hits (57%) and all their misses (43%). All possible outcomes is in the lower right at 100%. These are the results from 1000 runs. We could do 1000 more, but the numbers are already pretty well converged.
Within each of these nine squares is a histogram. There are ten bars in each histogram, the far left bar represents how often we have 0-10% equity. The second bar is 11%-20% equity and so on until the right hand bar is 90%-100% equity. The red line represents the average equity in that category.
The important question when flopping a set is “When we flop a set, how often do we get paid?” The number in the upper left histogram answers that: 7% of the time. These are the times that we hit a set and the other guy is interested in continuing with the hand. Notice in this great situation, our equity is very high, about 80% equity with a significant amount of the time having 90%-100% equity. These are the times that we wait for and really have the potential to get stacks in.
If we both hit 7% of the time and we miss 89% of the time, that is a ratio of about 12 misses to 1 mutual hit. Since we have about 80% equity we still need to hit a little more than that, so that is why 15 is a multiplier that people often want to see when trying to flop a set.
There is more to the story though. We have just as many hits where the opponent misses and we will likely pick up the pot. This shades our decision and lowers the multiplier we need. This is the derivation of how we come up with a multiplier of about 15 versus a nit opening range.
Using this tool, we can also see how well we do against a much wider opening range:
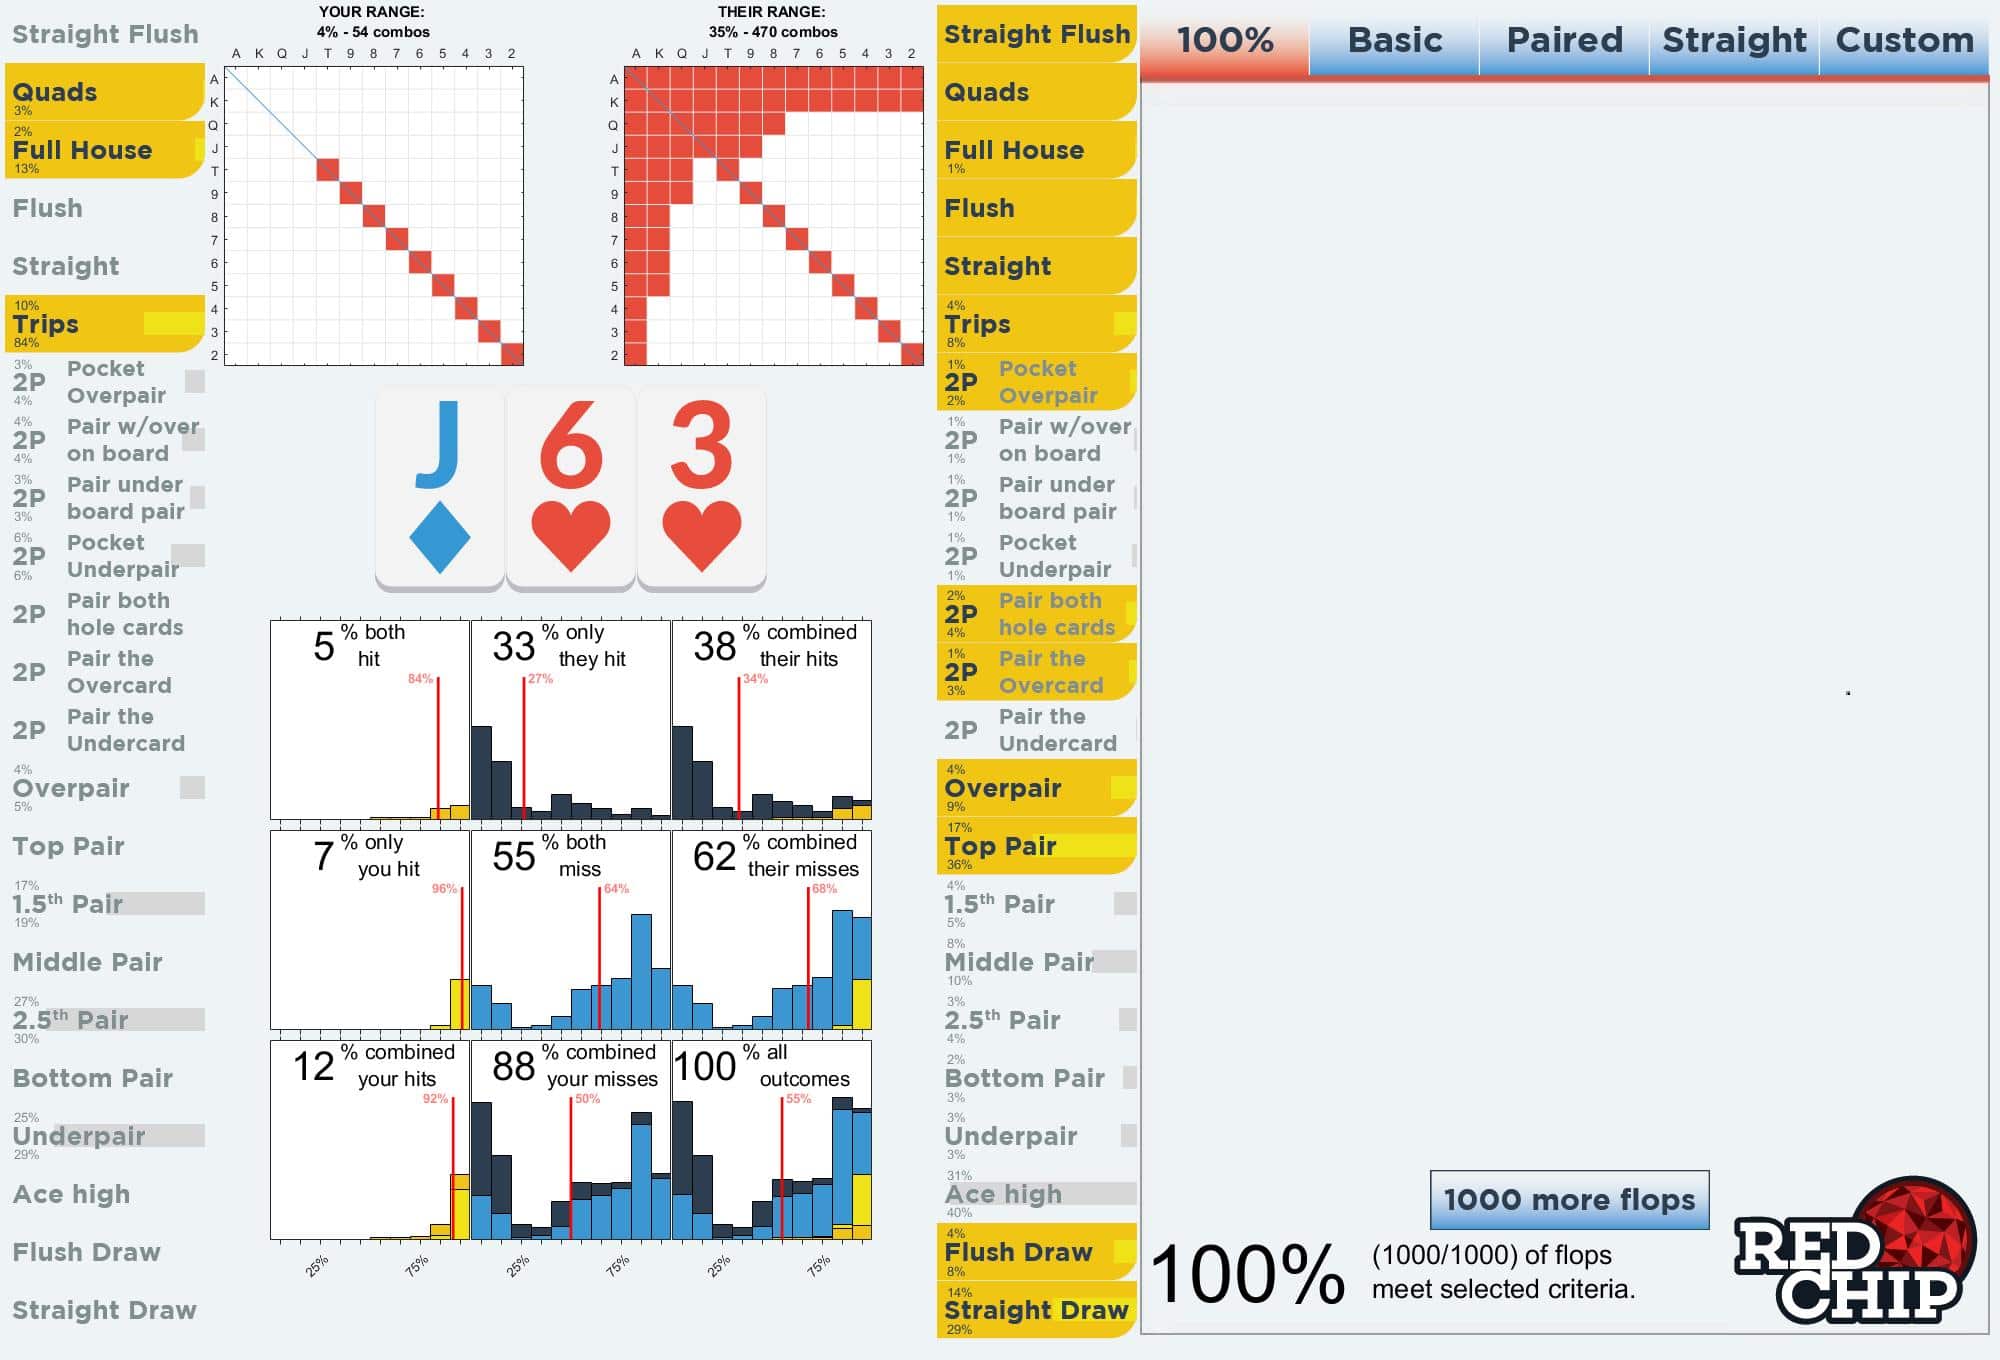
The numbers are not nearly as much in our favor. We hit a set just as often, but the opponent does not have anything to pay us off with since their loose range misses over 60% of the time whereas the nit hits over 60% of the time.
If we are in the pot with a super nit that has three-bet us with a crazy tight range of AA and KK then it looks like this:
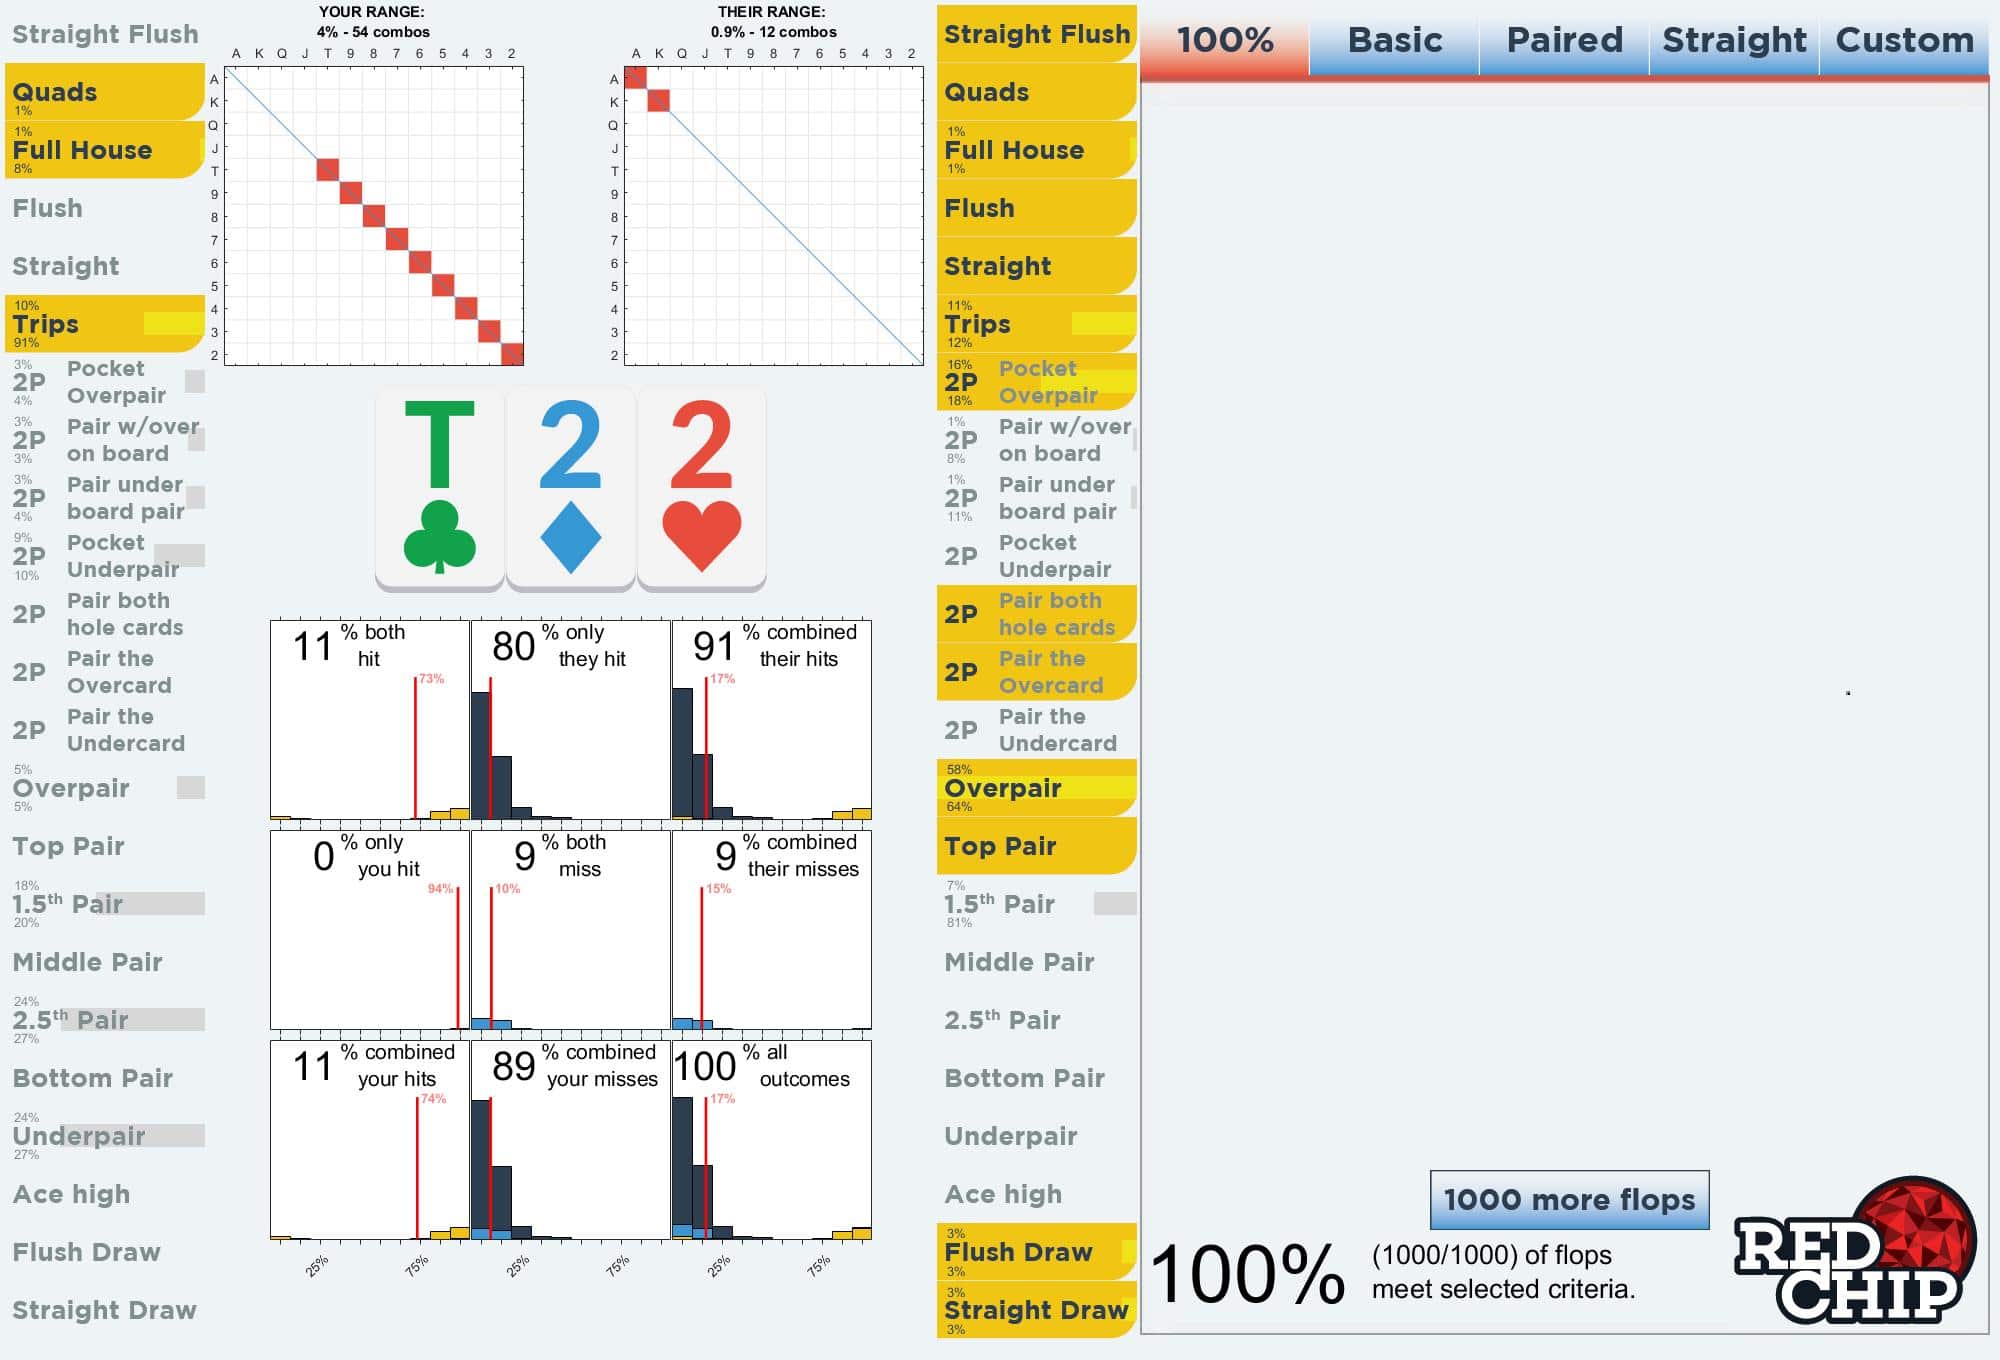
Where the opponent hits 91% of flops (the 9% being those times he has Kings and an Ace flops) This means we get paid off 11% of the time. However, look in that “both hit” bucket at the small amount of time we hit and have 0-20% equity. What are those? Those are the “Set over Set” coolers. They are infrequent, but notice how they drag the red average value line over to 73% equity, even though the most normal situation is to have about 80%-90% equity.
So how much money do you need behind to set-mine? As always, it depends. You can see that the amount of mutual hits changes wildly depending on how tight the opponent is, and that you actually want a tighter opponent because they hit more often.
This tool shows you more than just the “Hot Cold equity” because there is a more complete story behind the averages. Knowing that story will help you win more.
Hey, love the math and visuals together. Just a small request, could you summarize a little more at the end to confirm the original premise is correct, or go into a little more detail in the summary proving it is not correct and what to do because of the new info you are providing? Thanks!
@Senor,
I added a paragraph, thank you!
Seems to be a great tool, more complete and intuitive too.
How much ?
We are launching at $40 per user, one time fee.